The Eight Acceptance Gates for AI-Generated Reports
The Eight Acceptance Gates: How to Prove an AI-Written Report Is Safe to Deliver
AI can produce a neatly formatted due-diligence report in minutes — and it can just as easily produce one you would never dare sign off on. The real question has never been "how fast can it write," but "what proof do you have that it can be delivered?"
A Real Failure: Eight Years of Financials, All "–", and the Scorer Still Gave 9.8
We use AI to generate due-diligence reports for Hong Kong-listed companies. The core of such a report is financial data — readers will take it to HKEXnews (https://www.hkexnews.hk) and check every line. In a spot check before one delivery, we found that the summary table covering eight years of financial data had a "–" in every single cell. Meanwhile, the composite scorer at the end of the pipeline had already awarded the report 9.8.
The scorer was not broken. It checks structure: the table exists, rows and columns line up, nothing overflows, all sections present — all passed. What it does not check is whether the cells contain anything. That incident produced the eight acceptance gates: deliver a little slower if you must, but never let a report that merely "looks finished" out the door.
Why "There Is a PDF" Does Not Mean "Deliverable"
Start with our own numbers: over the past 30 days, 17 deliveries produced 5 rejected reports (6 rejection events in total), a one-pass rate of 70.6%. The rejections were almost never "the AI got the facts wrong." They were empty tables, tofu-box fonts, overlapping elements, footers pressed into body text — the generation side reported success every time, and the problems only surfaced at the moment of delivery, when a human finally looked.
"A PDF exists" only proves the generation pipeline finished. Deliverable means three things: the content genuinely exists, the layout is intact, and every claim can be traced back to evidence. None of the three is written into generation logs; all three must be proven by an independent checking layer. That is why gates exist.
The Eight Gates, One by One
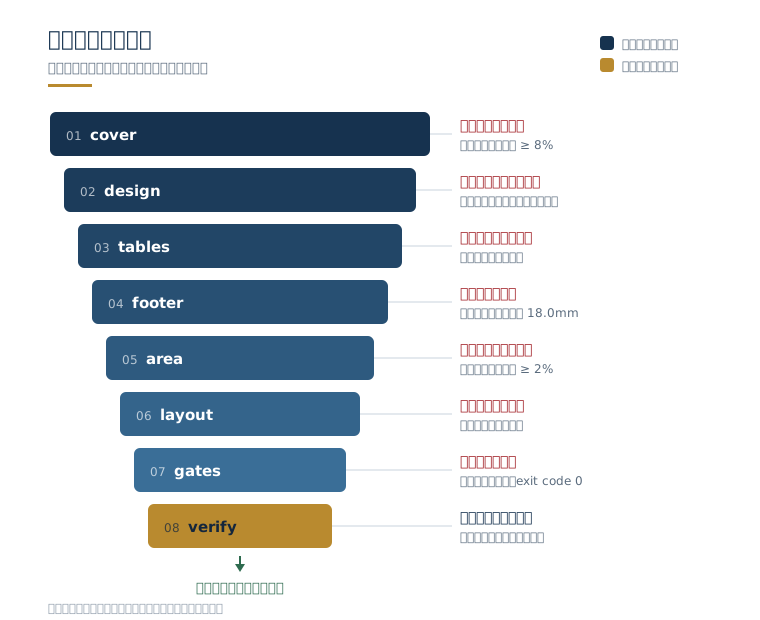
The order is fixed: cover → design → tables → footer → area → layout → gates → verify. The first seven check facts; only the eighth scores. The sequence cannot be swapped — the reason will be clear by the time you reach the last gate.
Gate 1 — cover: brand-color pixels on the cover ≥ 8%
What it checks: render the cover and measure the share of brand-color pixels; the threshold is 8%. Why it exists: the cover is a hot spot for silent failures — a rendering-engine upgrade or a renamed swatch and the color block simply vanishes, with zero errors anywhere in the log, leaving a bare black-on-white cover. Caught in practice: after one layout migration, the cover's brand-color block never rendered. The thumbnail "seemed to have a frame"; pixel measurement proved the color was never drawn at all.
Gate 2 — design: font size, contrast, and whether fonts actually loaded
What it checks: minimum body-text size, text-to-background contrast, and whether CJK fonts truly loaded. Why it exists: if the PDF rendering environment is missing a single font, every Chinese character becomes a tofu box, and the process reports no error whatsoever — every character is present in the text layer; only rendering reveals the truth. Caught in practice: an entire report rendered without Chinese fonts, screenshots full of tofu boxes; a text-layer-only check would have waved it through as a normal report.
Gate 3 — tables: tables must contain real content
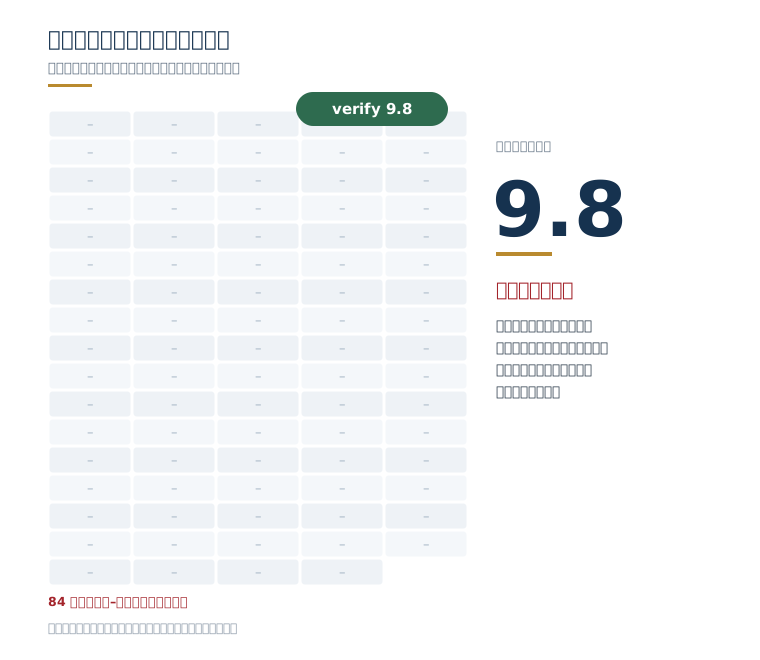
What it checks: table existence, row/column structure, and — most critically — per-cell fill state. Why it exists: "–" is a legal placeholder, but a large table that is all "–" means the data source was never connected. Caught in practice: a financial summary of 5 columns × 84 cells, every one "–", sailed through every prior check green because the other checks only confirmed "the table was drawn." Once this gate went live, tables with abnormal fill rates go red immediately, forcing you to fix the data before talking about layout.
Gate 4 — footer: measure footer spacing with coordinates, not eyes
What it checks: the minimum gap between each page's footer (page number, foot band) and the last line of body text. Why it exists: footer overlap is the classic defect invisible to a quick human glance and guaranteed to hit readers — when a page fills up, the page number lands right on the body text. Caught in practice: on page 5 of an old version the footer gap had shrunk to 3.5mm; after re-layout it opened up to 18.0mm. That difference is indistinguishable in a thumbnail; the gate measures coordinates and exposes it instantly.
Gate 5 — area: inner-page color bands and the safe area, pixels ≥ 2%
What it checks: brand-color area share on inner pages (threshold 2%) and whether content stays inside the page safe area. Why it exists: the most common silent failure on inner pages is the half-empty page — a section reduced to its heading, content never flowed in, while the layout still looks structurally complete. Caught in practice: pages whose section color bands never rendered were caught by pixel measurement — "the color does not exist" — rather than by a human's tolerance for whitespace.
Gate 6 — layout: overlap, clipping, out-of-bounds
What it checks: boundary relations between all elements — text frames stacked on text frames, charts clipped by page edges, tables running past the page boundary. Why it exists: under absolute-coordinate layout, one edit quietly shifts something somewhere else; the error never appears where you made the change. Caught in practice: after adjusting an upper section, the bottom strip of a lower chart was clipped; only page-by-page inspection of rendered output found it — text-layer checks can never see this class of problem. Rendered screenshots are based on headless Chrome (https://developer.chrome.com/blog/headless-chrome).
Gate 7 — gates: make sure every gate actually ran
What it checks: not the PDF — the process itself. Did all eight run? Was every exit code 0? Did anyone run only the final scorer and declare completion? Why it exists: skipping gates is the biggest hole; "running the composite score alone proves nothing" is the direct product of that lesson. The scenario it stops: the aggregator discovers an execution that invoked only the scorer, none of the seven preceding gates, and rules the run non-compliant, requiring the full chain to be rerun.
Gate 8 — verify: scoring comes last, because scores lie
What it checks: the composite quality score, converting the first seven gates' results into a number used for quality grading and trend comparison. Why it comes last: the scorer looks at structural completeness — tables neat, sections present, no overflow — and rewards it. The opening case is the proof: perfect structure, zero content, 9.8 all the same. Scores are a useful instrument, but only placed after seven fact checks do they stop being a source of false green lights.
Two Real Interceptions
Interception 1: footer overlap at 3.5mm. On page 5 of an old report, the gap between footer and body text was 3.5mm; the page was full, and the page number sat directly on the last line of text. Human review missed it — at preview zoom, that gap is indistinguishable to the eye. The footer gate measured the coordinates, blocked the delivery, and after re-layout the gap reached 18.0mm. "Minimum footer spacing" has been a hard threshold ever since.
Interception 2: an empty table, 84 cells. A financial summary of 5 columns × 84 cells, every one "–", still scored 9.8 from the composite scorer. Had this report gone out under the old process, the reader would have opened the financial chapter and found the core data empty — for a due-diligence report, that is the entire document invalidated. After the tables gate went live, "structure present, content empty" goes red on sight.
The common thread in both interceptions: the generation side reported success, and the problems existed only on the delivery side. The value of gates is moving delivery-side discoveries to before delivery.
Five Steps to Build Your Own Verification Gates
- List your "absolutely undeliverable" items: empty tables, tofu-box fonts, overlapping elements, footers pressed into text... Every entry must be measurable — pixels, spacing, fill rate. No unactionable adjectives like "beautiful" or "professional."
- One item, one gate: each gate checks exactly one thing and outputs exactly one exit code: 0 pass, non-zero block. No "warning mode" — warnings get ignored; exit codes do not.
- Fixed order: facts first, appearance second, scoring last: empty content and missing data get blocked first; layout defects next; the composite score always comes last, and a score-only pass never counts.
- Red means rework: if a gate fails, fix it and rerun the entire chain. There is no "ship now, fix later." The cost of a failed delivery far exceeds the cost of rerunning the checks.
- Every rejection adds a gate: each rejection is a new checkpoint waiting to be added. Your rejection rate will rise first and fall later — up because you are catching more; down because the same mistakes stop recurring. The 70.6% one-pass rate of the past 30 days was accumulated exactly this way, one gate at a time.
Closing: Gates Are Not Bonus Points — They Are the Anti-False-Green-Light
AI has pushed the production cost of reports toward zero and created an oversupply of reports that "look finished." The 9.8 is not wrong; treating it as the final verdict is. The design philosophy of the eight gates fits in one sentence: replace eyeball spot checks with machine checks, and replace "I think it's fine" with exit codes. Gates add no points to a report. They guarantee one thing only — when the light turns green, the report is genuinely ready to deliver.
Three Chart Suggestions for the Designer (Delivery Comment, Not Part of the Article)
- Eight-gate pipeline diagram: for the opening of "The Eight Gates, One by One," replacing the mermaid sketch. Eight horizontal nodes — cover→design→tables→footer→area→layout→gates→verify; the first seven in grayscale and labeled "fact checks," the eighth in brand color and labeled "composite scoring"; one small line under each gate stating its threshold (≥8%, ≥2%, 18.0mm).
- Empty-table contrast pair: for "Two Real Interceptions." Left: a thumbnail of the 5-column × 84-cell table, every gray cell showing "–," with a green "9.8" score tag pasted in the top-right corner; right: the same table after real data has been filled in. The visual point is the absurdity of placing a "green light" next to an empty table.
- Footer spacing diagram: for the Gate 4 paragraph. A zoomed-in crop of a single page, two horizontal lines marking the last line of body text and the page-number baseline; "old version 3.5mm" in red on the left, "new version 18.0mm" in green on the right, with a millimeter ruler to stress how hard the gap is to judge by eye.
More in Learn
- The 74k-star Open-Source Life Guide: What Its Evidence Grading Is Worth Copying
- DeepSeek's Open-Source Super-Agent Prototype: A Source-Level Breakdown
- PStack Deep Dive (Part 1): How a Cursor Plugin Turns Engineering Discipline into Executable Files
- PStack Deep Dive (Part 2): Two Agents, Five Special Designs, and How It Actually Lands